6 Discussion
6.1 Two Realisations of Spec-Driven Planning
Both frameworks plan and create specifications before they build, and both explore the codebase and launch subagents for the heavier research. They differ in who makes the planning decisions. Spec-kit has the agent resolve the open questions itself, making informed guesses based on the model’s training data. It fills a fixed set of template documents from what it finds and knows, and it turns to the user only where its own checks leave a question open, offering recommended choices to confirm. Its planning is therefore sensitive to the model’s capability and to how the autonomous exploration plays out. APM keeps the user as the authority. Its Planner goes through a series of question rounds with the user and brings back what it understood for approval before any document is written. It is directed to ask rather than assume, and it produces a few short planning documents that generalise across project types. The task brief the participants worked from was already detailed, yet under it APM still asked many targeted questions grounded in its research, while Spec-kit, with the same brief, asked few.
Both gate their planning and ask the user for approval. APM’s gates are points where the user approves each planning document, while Spec-kit’s are the agent’s own validation checks and a holistic presentation to the user at the end.
The planning turns differed in kind accordingly, as the planning buckets of Table 5.10 report. Spec-kit, planning mostly on its own, turned to the user only to confirm its recommended choices. APM brought the user’s decisions into the planning, requiring more substantive interactions.
That difference in authority does not show in the size of the planning phase, which carries no firm difference in cost, duration, or turn-prompt count, as the planning rows of Table 5.2, Table 5.7, and Table 5.9 report. What differs is where the planning work took place, which Table 6.1 details. Under Spec-kit the main agent did that work itself, issuing more requests to the model in eleven of the twelve pairs and making more tool calls in the same eleven. Under APM part of it was offloaded to subagents, which made more tool calls than Spec-kit’s in ten of the twelve pairs.
| Measure | n | Sign (+/−) | Median | HL | Mean | CI |
|---|---|---|---|---|---|---|
| Requestsa | 12 | 1 / 11 | −33.0 | −31.8 | −29.7 | [−44.5, −18.5] |
| Main tool callsa | 12 | 1 / 11 | −29.5 | −30.2 | −32.6 | [−54.5, −13.0] |
| Subagent requestsb | 11 | 8 / 3 | +26.0 | +25.0 | +25.8 | [+5.0, +48.0] |
| Subagent tool calls | 12 | 10 / 2 | +33.0 | +31.5 | +30.8 | [+7.0, +51.5] |
- P004’s merged Planner/Manager conversation, explained in note [a] of Table 5.2, puts the Manager’s requests in the planning phase. P004 is the single pair in which APM’s main agent was the busier of the two. Without P004 the request median, Hodges-Lehmann estimate, and mean are −35.0, −34.0, and −37.6. The cohort values are −33.0, −31.8, and −29.7. The main tool-call values are −30.0, −34.2, and −39.8 without P004 and −29.5, −30.2, and −32.6 for the cohort.
- P001’s APM session launched subagents whose transcripts the submission did not include, so the pair is excluded from this row.
Five sessions across the cohort fell well short. Two scored below fifty under APM and three under Spec-kit, as Table B.10 details, so the shortfall was not one framework’s alone. They did not all fail in the same way. The re-grade of Section 6.3.1 lifts a fault that occurred under both frameworks, leaving two Spec-kit sessions below fifty.
In Spec-kit’s largely autonomous planning, a step that settles an open question without the user can do so wrongly, and the build then rests on that decision. Its instructions set a ceiling on how many questions it may raise and have the agent reach a documented assumption wherever a reasonable default exists. The sparse questioning observed is what the framework instructs. APM puts its open questions to the user in the Planner’s question rounds and holds each planning document at a review gate. A wrong assumption can therefore meet the user before the build inherits it. The two remaining low-score sessions align with that difference in planning authority, but they do not establish that it produced them.
6.2 Coordinating the Implementation
Both frameworks build against their planning documents and revise them as findings require. Spec-kit carries the implementation out in the same agent that planned it. In APM, a Manager and its Workers carry it out across several agents and coordinate through the user. Those several agents shape what the implementation costs, and their coordination shapes what it demands of the user.
6.2.1 The Cost of Several Agents
Working across several agents changes where the context accumulation described in Section 2.2 occurs. Each APM conversation accumulates context just like Spec-kit’s, but handles only part of the work. At session scope, however, their costs add together: each builds its own cache and produces its own output. APM exchanges concentrated accumulation in one conversation for the aggregate cost of several.
The observed balance differed with each model’s context window limit and the resets that interrupted accumulation. Claude Code is expected to compact automatically at an auto-compaction threshold below that limit, and the user may compact manually. APM also supports Handoff, which opens a new conversation and context window, as Section 3.5 describes. We refer to all three transitions as resets. After each reset, context begins from a smaller starting point, accumulates, and enters the cache again.
Opus 4.7 had a one-million-token context window limit, large enough to hold the task from start to finish. Sonnet 4.6 had a two-hundred-thousand-token limit in Claude Code’s standard configuration [56], and conversations often approached its auto-compaction threshold.
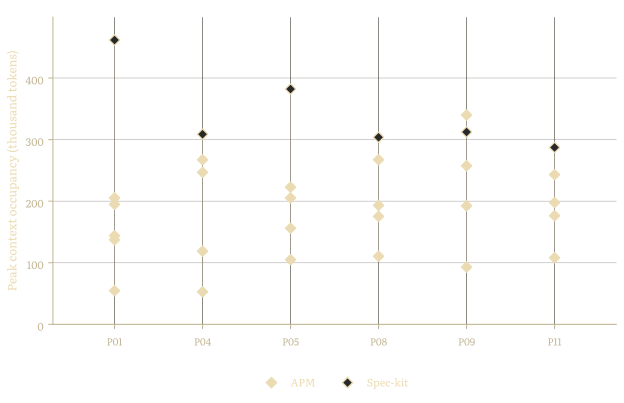
Figures 6.1 and 6.2 plot the peak of each context window. For example, a conversation that compacts twice uses three consecutive context windows and contributes three peaks. The highest markers are Spec-kit conversations that grew long without a reset. Most APM peaks form a low cluster, but a few APM markers reach the high ranges, one even passing the Spec-kit conversation it is paired with. These are all APM Workers. They accumulate the most context of any agent role in an APM session, and account for the largest part of what the session cost, as Table 5.3 details.
No conversation reset under Opus. APM’s several conversations together produced more output and cache writes than Spec-kit’s one, while its cache-read summaries were also higher despite one pair in the other direction, as the Opus rows of Table 5.5 report. Figure 6.1 shows the pattern behind those differences: Spec-kit has a few lone high markers, while APM has a wider spread reaching towards them. Without any reset to interrupt accumulation, distributing the work did not offset the aggregate cost of APM’s several conversations.
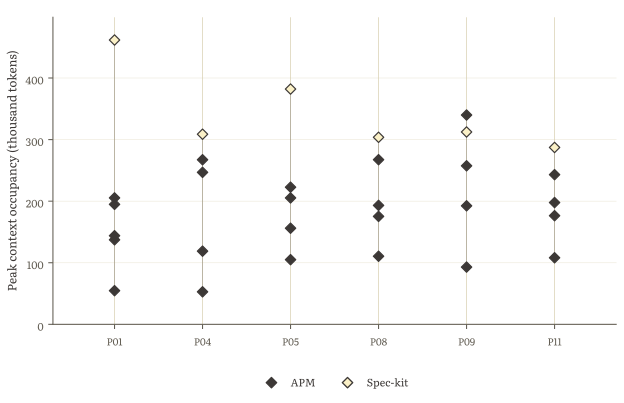
Under Sonnet, five of the six Spec-kit conversations compacted, three more than once, as Table 6.2 reports. Four APM sessions compacted automatically. The other two used Handoff instead, so every APM session reset once. Each APM reset occurred in the Worker assigned the C part of the task, the heaviest work in the build.
| Model | Framework | Sessions | Compacted | More than once |
|---|---|---|---|---|
| Opus | APM | 6 | 0 | 0 |
| Spec-kit | 6 | 0 | 0 | |
| Sonnet | APM | 6 | 4 | 0 |
| Spec-kit | 6 | 5 | 3 |
Spec-kit’s single conversation moved through consecutive context windows as it compacted. Before each reset, it grew close to the auto-compaction threshold, so later calls reread a large accumulated cache. Its cache-read cost exceeded APM’s, reversing the Opus group’s direction and offsetting APM’s output and one-hour cache-write excess, as the Sonnet rows of Table 5.5 report.
APM instead kept most of its conversations’ context windows smaller, so their calls reread less accumulated context. Figure 6.2 shows the difference: Spec-kit contributes repeated peaks near the auto-compaction threshold within individual sessions, while most APM context windows peak well below it.
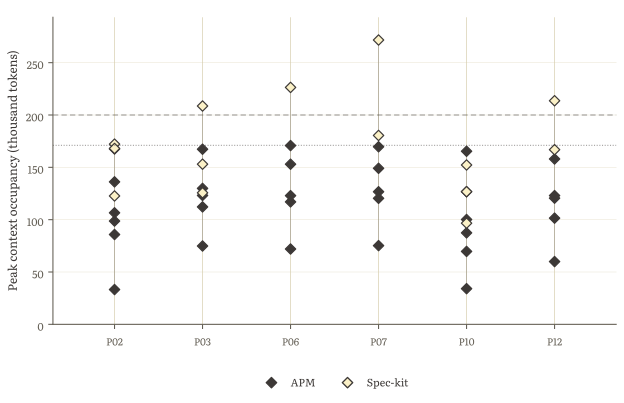
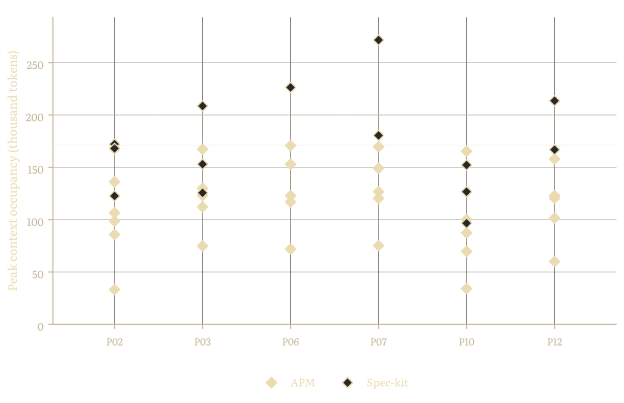
A platform issue complicates the Sonnet reading. In four Spec-kit sessions, the conversation continued beyond the model’s context window limit without automatic compaction, and Claude Code’s context window consumption indicator passed full. These sessions form the highest points of Figure 6.2 and appear to have been served by the model’s one-million-token variant, which the platform offered separately but did not identify. The additional accumulation therefore plausibly lifted Spec-kit’s cache reads.
Section 6.7 prices that excess and treats the anomaly as a threat to validity. Removing it leaves every Sonnet pair’s direction and the group’s sign count unchanged, as note [c] of Table 6.7 reports.
The cost result therefore appears to depend on how much of a task fits within the model’s context window limit. Under Opus, the whole task fit and the aggregate cost of APM’s several conversations dominated. Under Sonnet, the same task repeatedly pressed Spec-kit’s conversation towards the auto-compaction threshold, bringing the two frameworks’ costs close. A larger task that similarly pushes an Opus conversation towards its auto-compaction threshold could plausibly narrow APM’s cost premium. On such tasks, however, users might also try to limit context accumulation and its cost through manual compaction, making participant-controlled reset timing another influence on cost.
6.2.2 The Demands on the User
APM routes planning and implementation through the user, while Spec-kit leaves more of both to its agent. Spec-kit’s planning autonomy extends into implementation as it works through the task list largely on its own.
That difference appears in the user’s input. Table 5.8 reports far more turn prompts under APM than under Spec-kit. In implementation, Table 5.10 reports that most of APM’s prompts are protocol. These include the exchanges between Manager and Worker conversations that APM places in the user’s hands, one for each dispatched Task or batch.
Standard prompts are the user’s own non-command messages, which may carry instructions or other content directing the agent. They are few under both frameworks. Table B.8 in Appendix B.2 reports that APM’s few standard prompts reach the Manager rather than the Workers. Together, the turn-prompt and role data show that participants passed through APM’s coordination points, though prompt counts alone cannot tell how much control they exercised through them.
Spec-kit asks much less. Its few turns are the protocol command that launches the implementation and an occasional short or standard follow-up, too few to read as a settled composition. The agent proceeds largely on its own, and the user has little to do until the build is done. This concentrates review into a single accumulated diff.
Each turn prompt opens an interval of agent work. In implementation, APM added a median of eight prompts, and its turn time was higher in eleven of the twelve pairs. That turn time made up most of the phase’s duration difference. Tables 5.9 and 5.7 report the additional interaction and time falling in the phase where APM’s user-mediated coordination operates.
APM’s several-agent implementation plausibly contributes to its larger model request count. APM issued more requests than Spec-kit in every one of the twelve pairs, and its main agents made more tool calls in all twelve as well, as Table 6.3 reports. Both directions reverse the planning phase, where Spec-kit’s main agent led on the two measures. Each agent also produces its own output, which is part of why APM’s implementation cost the more of the two, as Section 6.2.1 explains.
| Measure | n | Sign (+/−) | Median | HL | Mean | CI |
|---|---|---|---|---|---|---|
| Requests | 12 | 12 / 0 | +97.0 | +113.0 | +121.0 | [+67.0, +185.0] |
| Main tool calls | 12 | 12 / 0 | +135.5 | +151.2 | +156.6 | [+103.5, +212.5] |
APM’s implementation involved more activity on both sides of the conversation: its agents made more requests and tool calls, and its users interacted with them more often.
6.3 Behind the Functional Score
The total score is the study’s one measure of what each session produced. A grader that judges only behaviour can miss sound work, and the score read alone says nothing about what the work cost.
6.3.1 Grading with a Black Box
The grader judges a submission only by the task-required behaviour of the running program, never its source, as Section 4.5.3 describes. A single fault that blocks the program’s responses can therefore be recorded as near-total failure, even where the rest of the implementation may be sound.
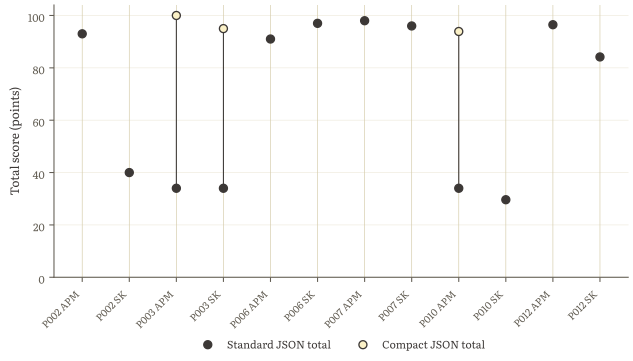
The C part of the task required every participant to implement a JSON parser and route each MCP request to its requested operation. MCP carries requests as JSON-RPC objects [48], and the JSON standard treats whitespace between fields as insignificant [57]. Three Sonnet implementations shared one defect. Their parsers accepted a compact request such as {"id":1}, but not the ordinary spaced form {"id": 1}. A conformant parser must accept both forms; failing to handle whitespace is an incorrect implementation of the task.
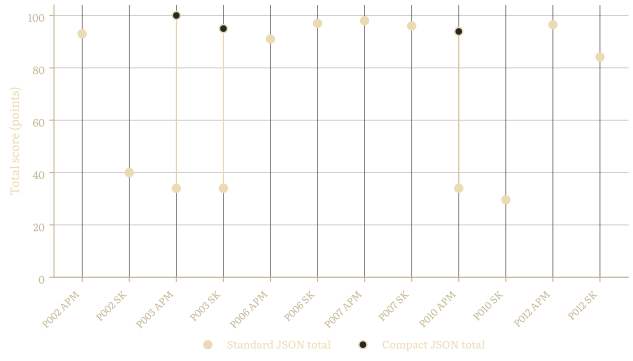
Each scored 34.0 points, with the Python part complete and almost all of the C part lost. The grader’s ordinary JSON requests elicited no response, so it could not exercise the affected C programs’ behaviour at all. When re-graded with compact requests, the three sessions received diagnostic scores from 93.9 to 100.0. Figure 6.3 plots the full Sonnet group, and Table 6.4 gives the three changed scores.
| Session | Standard total score | Compact-input diagnostic score |
|---|---|---|
| P003 S1 (APM) | 34.0 | 100.0 |
| P003 S2 (Spec-kit) | 34.0 | 95.0 |
| P010 S2 (APM) | 34.0 | 93.9 |
The re-grade recovers three of the five sessions below fifty, both APM sessions and one Spec-kit session. The two scores it does not lift remain indeterminate. They may conceal sound work beyond the re-grade’s reach, or they may be genuine shortfalls. The three recovered sessions belong to two participant pairs. In one, both framework sessions carried the defect, so compact input moves the APM-minus-Spec-kit difference from 0.0 to +5.0 points. In the other, only the APM session was affected, moving the difference from +4.4 to +64.3 points. Across all six Sonnet pairs, the compact-input diagnostic favours APM in five. Its median difference is about +8.7 points, while the Hodges-Lehmann estimate and mean are +23.5 and +21.8, raised by the two large gaps, as Table 6.5 reports.
| Group | n | Sign (+/−) | Median | HL | Mean | CI |
|---|---|---|---|---|---|---|
| Sonnet | 6 | 5 / 1 | +8.7 | +23.5 | +21.8 | [−6.0, +64.3] |
This diagnostic re-grade helps interpret some low scores as hiding otherwise sound implementations and gives APM the more favourable Sonnet pattern. The standard total scores remain the basis of the framework comparison because the re-grade tests only this fault class.
6.3.2 Cost versus Score
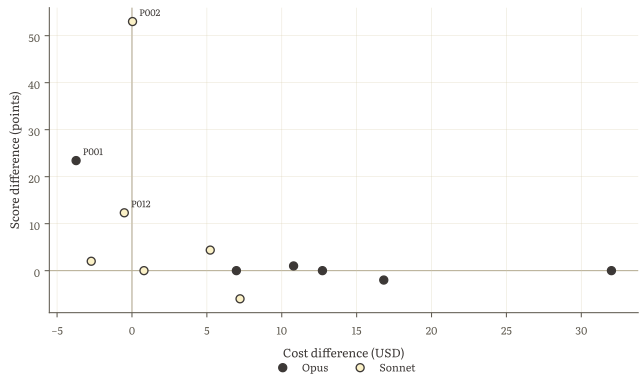
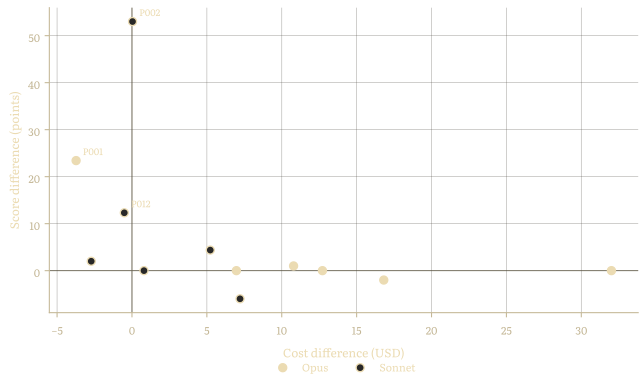
Across the cohort, APM cost more, while its total-score median, Hodges-Lehmann estimate, and mean were positive. The score interval includes zero, so the paired comparison carries no firm difference, as Sections 5.1 and 5.3 report. Figure 6.4 plots the paired values together. Most participants had an APM cost premium with a score gap at or near zero. Under Opus, the larger premium came with both sessions close to the score ceiling. Under Sonnet, costs were close and APM’s paired score summaries were more positive.
The same plot shows three participant pairs that depart from that pattern. In each, APM scored clearly higher while costing about the same or less. These are individual observations and do not change the cohort reading.
The comparison prices software production. APM cost more for a functionally comparable outcome, but software also incurs corrective and maintenance costs after delivery. A more expensive session could still yield a lower lifecycle cost if it leaves software easier to understand, change, and repair. Those qualities depend on the maintainer, later changes, and other conditions that vary across projects and over time. This study therefore confines the comparison to production cost and functional behaviour.
APM’s added cost accompanied a more structured workflow, which the total score does not read directly. In this study, the task proved bounded and self-contained. With either model and without either framework guiding it, Claude Code could plausibly work through the task largely on its own while launching subagents where needed. The study did not test that counterfactual, so it leaves open whether the underlying coding agent would achieve comparable total scores, or how the grader would read its work. APM’s heavier structure therefore had little total-score gap to close, while whether that structure earns its cost lies beyond what the total score can show.
6.4 Perceived Versus Measured Behaviour
The ratings reach what the instruments do not: a participant’s confidence in what was built, and the control they kept over building it, leave little trace in a transcript or a score. We read each rating of Section 5.4 against the behaviour recorded beneath it, for agreement and for divergence.
Effectiveness and confidence favour APM far more strongly than the total-score comparison does. No participant rated Spec-kit higher on either, as Table 5.15 reports. Yet the paired total-score comparison carries no firm difference across the cohort, so higher scores alone do not explain it. The accounts that follow point instead to participants’ role in the process and the control they retained over the build.
One participant, who used APM in their second session, wrote that they were “much more confident in APMs output” despite “not having manually checked either of the code output”. They named the framework being “strict as to enforcing the PRD when speckit was more lenient” as the reason. Their confidence reads as trust in a specification the participant helped settle during planning. It is not a judgement of code they verified, and it echoes the reading Section 6.1 already builds from the scores. The Spec-kit accounts name the corresponding lack of control directly. One participant wrote that they “felt lack of control when it came to the deliverables and how they were produced”. Another found it odd that the framework did not operate interactively, letting the agent take its own decisions with the user left out entirely.
Effort is the one item where APM is behind. It was the more effortful framework for a slight majority of participants. That effort does not align with where APM adds turns. Section 6.2.2 reads APM’s extra implementation turns as the intended user-mediated coordination. Section 6.1 reads its planning turns differently: the count there sits level between the frameworks, but APM’s prompts are the more substantive ones, since its Planner brings real open questions to the user while gathering context. One participant described planning as the “most demanding thing” because it involved “questions about the whole plan in advance”. They then wrote that the Workers executed the task “easily without any assistance from me”, apart from authorising terminal commands and checking that it aligned with the task.
Frustration points the other way from effort. APM was still rated the less frustrating framework, despite the added time and turns, so the added burden did not compound into felt friction.
Mental demand and the effort spent checking the agent’s output have no measured counterpart. That absence is itself a finding. Some of the cognitive work that AI-assisted development demands leaves almost no trace in the instrument set. Self-reporting attempts to fill that gap. One participant’s account of a Spec-kit session is the clearest instance. They wrote, “I didn’t have a way to validate the results of the session despite taking the agents word which run tests with the mock instance”. They added, “I didn’t do my due diligence in reviewing the code output”. That session’s total score is the lowest in the cohort, so here the participant’s own doubt and the measured outcome point the same way. The account reflects a common failure in AI-assisted software development. When developers stop reading generated code, unreviewed diffs accumulate, leaving them to trust tests that were themselves generated by the agent and never reviewed.
6.5 APM’s Value Across the Findings
Across the cohort, APM achieved a comparable total score with longer sessions in every pair and a higher cost. Each score summary favoured APM, although the interval includes zero, as Chapter 5 reports. With six pairs per model group, the split locates that pattern under Sonnet without establishing a model-specific effect.
The cost trade-off depended on how much of the task fit within the model’s context window limit, as Section 6.2.1 explains. Under Opus, APM’s several conversations cost more while both frameworks scored near the ceiling. Under Sonnet, APM’s score summaries were more positive and the frameworks cost about the same. The study did not vary task size, so it cannot establish when distributing work across conversations offsets their aggregate cost.
The process and perception findings give APM’s structure value beyond the total score. Its additional interaction and time fall in implementation, where user-mediated coordination operates, as Section 6.2.2 reports. Participants remained involved in planning and implementation, favoured APM in effectiveness and confidence ratings, and described greater control. For users who want that role, APM’s additional time and interactions may represent productive friction: opportunities to inspect decisions and preserve understanding of the resulting system. Removing those points of interaction allows faster autonomous execution, but leaves fewer occasions to engage with software for which the developer remains responsible.
This value depends on the work and on how the user runs APM. On small or straightforward work, where the user can review a single agent’s output directly, the same friction would likely add cost and time for little benefit. How often the user meets these points also depends on how they size and dispatch Tasks, which participants chose freely. The study examined neither that choice nor whether participants used these points to review code, prevent defects, or reduce technical debt.
6.6 Learning Effects
The within-participant comparison has each participant carry out the same task twice, with the environment reset between the two sessions so that no code, workspace state, or assistant context passes from the first into the second. Anything a participant took from their first attempt could then lift their second, and left unaccounted it would be indistinguishable from an effect of the framework used. Reading the cohort for such an effect holds to the same reproducible standard as the rest of the chapter, and so sets qualitative transcript reading aside.
That standard fixes what evidence the question can draw on. The chapter measures each session along four dimensions, and the score is not the only measure that could in principle bear on learning. The interaction measures of Section 5.2.2 might shift as the task grew familiar. The obstacle is that the comparison is within participant, between two sessions that used different frameworks. The two demand such different interaction that the difference between a participant’s sessions is already large from the framework change alone. A learning-driven change could merge into those framework differences in the interaction measures, session cost, and session duration. The score is the task’s graded outcome on one rubric, directly comparable across a participant’s two sessions and the measure practice should raise. We therefore read the score alone for learning effects.
One limit bounds what the score can show of a learning effect: the rubric’s hundred-point ceiling. Most sessions scored near it, as Table 5.12 reports, and Table B.10 reports nine of the twelve participants above ninety in their first session. A practised second session had little room to register a gain, and only three participants entered their second with substantial ground to recover.
The individual changes have no common direction. Four participants scored higher in their second session and four scored lower, as Table 6.6 lists, while the other four scored the same. Nine changes lay between a two-point loss and a six-point gain. Of the three larger movements, P002 gained 53.0 points while P001 and P012 lost 23.4 and 12.3 points. These movements all favour APM regardless of where it fell in the order, so they cannot separate a practice effect from the framework or from session-to-session variation.
| Participant | Model | Second framework | Score changea |
|---|---|---|---|
| P001 | Opus | Spec-kit | −23.4 |
| P002 | Sonnet | APM | +53.0 |
| P004 | Opus | APM | −2.0 |
| P006 | Sonnet | Spec-kit | +6.0 |
| P007 | Sonnet | Spec-kit | −2.0 |
| P008 | Opus | APM | +1.0 |
| P010 | Sonnet | APM | +4.4 |
| P012 | Sonnet | Spec-kit | −12.3 |
- The change is the second-session score minus the first-session score. Positive values indicate a higher score in the second session.
P010 reads differently under the diagnostic re-grade of Section 6.3.1. Their first-session diagnostic score remains 29.6 while the second rises to 93.9, widening the difference from 4.4 to 64.3 points. The re-grade recovers a strong second implementation but reaches only one fault class; the unchanged first-session score cannot establish that the first implementation was unsound. The diagnostic difference still cannot separate learning from the framework change.
The order split supports the same cautious reading. Table B.11 of Appendix B.3 separates the paired total-score difference by which framework each participant met first, and both confidence intervals span zero. Counterbalancing distributed first exposure across the frameworks, although the realised seven-to-five allocation was not perfectly even.
The total scores have no cohort-wide learning direction. Mixed changes, the score ceiling, and the uneven order allocation prevent them from identifying a learning effect.
6.7 Threats to Validity
A measured comparison is exposed at four points: what its instruments capture, what else could have produced its differences, how far its findings reach, and who built what was measured. Each threat identifies the inference at risk, the study’s response, and the remaining limitation.
6.7.1 Construct Validity
The turn-prompt buckets were constructed for this study to describe the form the user’s interaction with the agent took. The three buckets of Section 4.5.2 separate a framework command from a short message and a longer one at a fifty-character threshold. The study sets that boundary. As a description of interaction form the buckets measure what they were built to measure. As a stand-in for the effort behind the interaction they are weaker. A framework command is a few keystrokes for the user and can set a substantial amount of agent work in motion, while a short reply may follow a long stretch of reading. The comparison they support between the frameworks is therefore one of interaction form, and any reading of user effort taken from them carries that gap.
Reported session costs standardise token consumption across sessions. For each conversation, every request’s tokens are priced against the published per-token rates of Appendix A.4. A developer’s total cost would also include the participant’s time and the cost of correcting and maintaining software after delivery. Neither is measured here, and both can outweigh the token cost of the session that produced them. The paired differences are untouched by that, since both sides of every pair are priced identically.
The cost of a session is a floor rather than a total, for two reasons. When a conversation compacts, the platform makes a further call to summarise the context it is about to discard. That call is not written to the transcripts participants supply, so its tokens are absent from every figure here. Nine of the twenty-four sessions compacted at least once, with twelve compactions between them. A session is also measured only to the three-hour cap of Section 4.4.3, so anything after that boundary lies outside every value derived from the transcripts.
The remaining dimensions’ instruments each reach a defined part of the session too, and what falls outside differs between them. The process measures locate activity on the transcript’s timeline, so a participant reading the codebase, testing a build, or thinking a decision through registers only as an interval between turns. The functional measures test the running program’s behaviour against the behaviour the task asks for, in the manner of assertions, so they say nothing about code quality, maintainability, security posture, or the debt a solution leaves behind. A single blocking fault also reads there as near-total failure, which Section 6.3.1 shows is not hypothetical. The perception measures are single self-reported ratings standing in for constructs such as mental demand and effort, which dedicated instruments measure through several items each and which one rating cannot separate. Each dimension’s headline measure carries its own claim, and none of them stands in for another.
We chose a contained replica of Open eClass over a live instance. The shared replica of Section 4.4.2 pins the platform to a fixed upstream baseline and seeds deterministic fixture data. Every participant develops against identical state and the grading runs against an equivalent one, which is what makes the cohort comparable and the scoring reproducible. The choice gives up any property of a live deployment the replica does not reproduce, since the task never exercises it. Such properties include timezone handling of locale-formatted dates, session-cookie behaviour under load, cross-origin interactions with the mock single-sign-on service, and upstream behaviour that has shifted since the pinned baseline.
6.7.2 Internal Validity
Each participant carried out the same task twice, so familiarity gained in the first session could lift the second and be taken for an effect of the framework. Counterbalancing the framework order exists to separate the two, as Section 4.4.3 describes, and the realised allocation left the four assignment cells uneven. The order splits of Appendix B.1 and their counterparts show no order effect on any headline measure. Section 6.6 reads the total score further, participant by participant, and finds no cohort-wide direction in it. The evidence, however, reaches an absence in our measures and does not establish that no learning occurred.
The framework comparison is paired within each participant, and the model comparison is not. Each participant kept one model across both sessions, so a difference between the Opus and the Sonnet group is a difference between six participants and six others, and it carries their skill and working style along with the model. Section 4.6 therefore reads every statement between the model groups descriptively.
Neither Claude Code nor the comparison framework was version-locked across the study window. Spec-kit sessions used a range of releases, which we audited release by release over the instructions installed into the project. One release changed what the agent is told, and that by a single line, as Section 4.3 records and Appendix A.1 reports. What the audit establishes is that the cohort met one workflow throughout, while whether that single line shifted the sessions meeting it lies beyond its reach.
Claude Code itself was updated repeatedly over the same period, so some participants’ two sessions ran on different versions of it. One instance of that drift left a mark on the measures. In four Sonnet Spec-kit sessions, the conversation continued past its reported context window limit without automatic compaction. Claude Code continued to identify the model as Sonnet 4.6 after its context window consumption indicator passed full. The sessions appear to have been served by the model’s one-million-token variant, which the platform offered separately but did not identify. Table 6.7 gives the cost of the resulting cache-read excess. Earlier compaction could have altered the agent’s subsequent behaviour, making any counterfactual session cost hypothetical.
| Participant | Cache reada | Above boundb | Cost | Session cost |
|---|---|---|---|---|
| P003 | 30755.9 | 985.4 | 0.30 | 14.73 |
| P006 | 16654.5 | 1487.1 | 0.45 | 8.25 |
| P007 | 45132.7 | 6042.5 | 1.81 | 19.46 |
| P012 | 26723.5 | 944.0 | 0.28 | 13.42 |
- All cache-read tokens, including those accumulated below the 171k observed automatic-compaction bound.
- Summed over every call whose context stood above the bound, the part standing above it, priced at that call’s own cache-read rate and capped at the reads the call made.
- Removing each session’s excess from its Spec-kit side leaves every Sonnet pair’s direction and the group’s sign count unchanged. The Sonnet session-scope median, Hodges-Lehmann estimate, and mean become +0.57, +2.16, and +2.15, against the +0.42, +1.25, and +1.68 of Table 5.2.
Resetting a conversation was partly a participant decision. The platform is expected to compact automatically as a conversation nears the auto-compaction threshold, but the anomaly above shows that a reset was not guaranteed. Participants could compact manually at any point. Spec-kit conversations under Sonnet reset both automatically and manually, as Table 6.2 reports. A reset changes what every later call is charged for, so where the participant chose the timing, subsequent cost reflects their judgement alongside the agent’s and framework’s behaviour. The two cannot be separated: the same accumulated context is both a product of work under the framework and a reason for the participant to reset it.
Participants knew which framework they used in each session, because blinding was not possible: the two workflows differ visibly in what they ask of the user and how the agents behave. They also knew the two were being compared. The ratings of Section 5.4 are therefore open to recall bias and to a pull towards the answer a participant expects to be wanted, and no instrument-side measurement corrects either. Section 6.4 reads each rating against the behaviour measured beneath it and reports the divergences as findings. That reading does not isolate the bias, since a participant answering as they believe is wanted may land either with the measures or against them, so neither agreement nor divergence identifies it.
6.7.3 External Validity
The study is conducted on one coding agent, against one task, in a setting between laboratory and field conditions. The task asks for work in two languages and research into an unfamiliar legacy codebase, as Section 4.4.1 sets out, exercising a demanding end-to-end workload. It is nonetheless one task rather than a benchmark of many, and it runs against the contained environment the construct-validity discussion above describes, which fixes what the cohort meets at the price of a live deployment’s variety. The findings hold within that scope. They do not reach other coding agents, projects where developers hold deep domain ownership, work simpler or less knowledge-intensive than this task, work substantially larger than it, or purely laboratory or natural settings. This boundary bears directly on the cost interpretation, which Section 6.2.1 relates to how much of the task fits within the model’s context window limit.
Both the wider setting of artificial intelligence and the two frameworks move quickly, and they move for different reasons. Token prices, model availability, and the pace at which agentic frameworks release belong to AI-assisted software development at large. The command sets, agent instructions, and workflows examined here belong to APM and Spec-kit, and change at each project’s own pace. Every statement of either kind belongs to the study window of Section 4.3. The cost values of Chapter 5 are dollar equivalents priced from the rate card of Appendix A.4. They are defensible against that snapshot and would need re-estimating under a materially different one. The descriptive claims about how each framework behaves are tied to the releases tested.
Our measures were built for this comparison and have been applied once. Some take their shape from the frameworks under it: the protocol bucket of Section 4.5.2 is an example, as it measures interaction only through commands issued by the two frameworks used in this comparison. The parser also reads transcripts produced by Claude Code, a closed product whose transcript format has changed since the study window. How far the methodology reaches beyond this comparison is untested.
6.7.4 Reliability
Before the case study, the author independently created APM and the codebase that the task extends. As part of this thesis, we developed APM v1, then designed the study and its case-study methodology, wrote the task and participant brief, and built the task environment. We also recruited the cohort, which comprises twelve university students and working professionals. The within-participant comparison supports a claim within this cohort, not an inference about a wider population.
Additionally, we built the parser and the grader the study uses. The grader applies the same fixed assertions to each of a participant’s submissions, so automated scoring leaves no interpretive discretion at that step. It does not, however, make the task, rubric, or measurement choices independent. Nothing in the study’s design offsets the resulting author bias. AI assistance was used throughout this work, in its engineering and its writing. The infrastructure and analysis scripts are published openly. The dataset is published encrypted to protect the participants, and its key is available to reviewers on request. Together they allow our measurements and scoring to be independently reproduced.
The chapters draw several views from the same twenty-four sessions. Each dimension has one session-scope headline measure. Phase and role scopes, measurement breakdowns, and participant-group breakdowns explain that result rather than carrying separate primary claims. The smaller group breakdowns have wider uncertainty and include differences between participants. The analysis scripts produce the statistics, tables, and figures.