5 Evaluation Results
5.1 Economic
An APM session cost a median of about $35 under Opus and $15 under Sonnet, against Spec-kit’s $24 and $14, as Table 5.1 reports. APM was the more expensive of the two under both models, by a wide margin under Opus and only slightly under Sonnet. Within a model each framework’s median, Hodges-Lehmann estimate, and mean lay close together. The two model groups are read apart, however, since the Opus sessions cost roughly twice the Sonnet ones at that model’s higher rate. The two frameworks placed that cost differently across the task’s phases. APM’s fell mostly in implementation, at a median close to $28 under Opus and $12 under Sonnet, while its planning cost was the smaller of the two and stayed below Spec-kit’s.
| Group | Scope | Framework | Median | HL | Mean |
|---|---|---|---|---|---|
| Opus | Session | APMa | 35.20 | 35.57 | 36.67 |
| Spec-kit | 23.94 | 23.94 | 24.08 | ||
| Planning | APM | 5.50 | 5.85 | 6.53 | |
| Spec-kit | 6.20 | 6.84 | 7.04 | ||
| Implementation | APM | 27.74 | 27.74 | 29.89 | |
| Spec-kit | 17.73 | 16.69 | 16.98 | ||
| Sonnet | Session | APM | 14.58 | 14.58 | 14.54 |
| Spec-kit | 13.54 | 13.54 | 12.86 | ||
| Planning | APM | 2.67 | 2.67 | 2.66 | |
| Spec-kit | 3.77 | 3.81 | 4.28 | ||
| Implementation | APM | 12.22 | 11.71 | 11.83 | |
| Spec-kit | 9.76 | 9.69 | 8.58 |
- P009’s assigned-Opus APM session records both Opus and Sonnet tokens in their APM agent transcripts. The row prices calls as recorded, so it is not a pure Opus session. P009 has the largest paired difference within the Opus group.
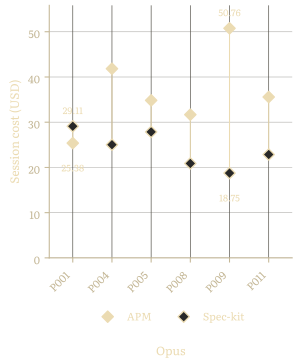
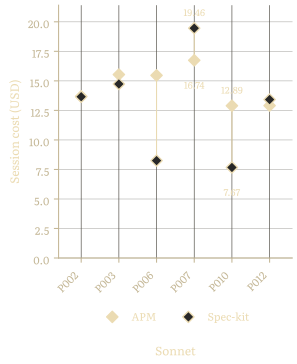
Figure 5.1 plots each participant’s two session costs. Under Opus, APM’s sessions ran from $25.38 to $50.76 against Spec-kit’s $18.75 to $29.11, while under Sonnet the wider spread was Spec-kit’s, from $7.67 to $19.46 against APM’s $12.89 to $16.74.
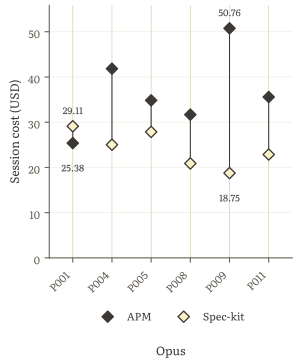
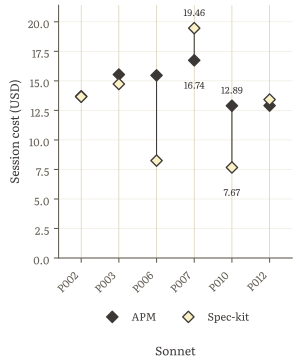
Paired within each participant, the APM session incurred the higher dollar-equivalent cost for nine of the twelve, and all three summaries of the difference are positive. The median and the Hodges-Lehmann estimate fall close together and the mean sits somewhat higher, a sign of a few large values pulling the average up. The Wilcoxon interval excludes zero, though its width leaves the size of the difference imprecise.
The difference behaved differently in the two model groups. Among the participants who worked with Opus, five of the six APM sessions cost more. The difference was large on all three summaries, with the median and the Hodges-Lehmann estimate close together and the mean a little above. Those differences run from $3.73 less to $32.01 more. Among the participants who worked with Sonnet, the difference was small on all three summaries and mixed in direction, running from $2.72 less to $7.22 more. Those large Opus values pulled the cohort mean up, so the cohort-level cost difference comes mostly from the Opus group.
Only the implementation phase carries a cohort difference of its own.1 APM’s implementation cost was the higher in nine of the twelve pairs, with an interval excluding zero, and it set the direction of the overall difference. Its planning cost was the lower in eight of the twelve, but its interval spans zero, so the phase carries no firm difference. The implementation excess concentrated within the Opus group, where APM cost more in all six pairs, against three of the six under Sonnet. Planning stayed mixed in both, at three of the six pairs under Opus and one of the six under Sonnet.
Table 5.2 gives these differences at session scope and in each phase, for the cohort and within each model group.
| Group | Scope | n | Sign (+/−) | Median | HL | Mean | CI |
|---|---|---|---|---|---|---|---|
| Cohort | Session | 12 | 9 / 3 | +6.10 | +6.10 | +7.14 | [+0.42, +14.14] |
| Planninga | 12 | 4 / 8 | −0.84 | −1.27 | −1.07 | [−3.53, +0.61] | |
| Implementationb,c | 12 | 9 / 3 | +6.52 | +6.52 | +8.08 | [+2.08, +12.65] | |
| Opus | Session | 6 | 5 / 1 | +11.75 | +11.89 | +12.60 | [−3.73, +32.01] |
| Planninga | 6 | 3 / 3 | −1.20 | −1.20 | −0.51 | [−6.64, +9.44] | |
| Implementationc | 6 | 6 / 0 | +10.66 | +10.66 | +12.91 | [+2.08, +34.96] | |
| Sonnet | Session | 6 | 4 / 2 | +0.42 | +1.25 | +1.68 | [−2.72, +7.22] |
| Planning | 6 | 1 / 5 | −0.84 | −1.10 | −1.62 | [−6.05, +0.28] | |
| Implementationb | 6 | 3 / 3 | +1.37 | +2.80 | +3.24 | [−2.15, +13.26] |
- P004’s APM Planner and Manager ran in one conversation, so the Manager’s work is recorded under the planning phase, and under the Planner role wherever a measure separates the roles. This makes the cohort planning difference less negative. Without P004 the median, Hodges-Lehmann estimate, and mean are −1.10, −1.77, and −2.02, rather than −0.84, −1.27, and −1.07.
- P006’s Spec-kit implementation work is recorded under planning; see note [c] of Table 5.6. That session’s implementation phase therefore shows no cost. This raises the cohort implementation difference. Without P006 the median, Hodges-Lehmann estimate, and mean are +5.99, +5.86, and +7.61. The cohort values are +6.52, +6.52, and +8.08.
- P009 is the mixed-model cost case described in Table 5.1. It shifts all three cohort implementation row summaries, most visibly the mean. Without P009 the median, Hodges-Lehmann estimate, and mean are +5.99, +5.69, and +5.63. The cohort values are +6.52, +6.52, and +8.08.
Figure 5.2 plots each participant’s session difference beside its two phase parts. The implementation difference sits above the planning difference in eight of the twelve pairs.
![Per-participant paired cost difference by scope, APM minus Spec-kit, in US dollars. The bar gives the session difference and the markers the planning and implementation differences within it. The reference line marks no difference. P004 and P006 have the phase-attribution caveats of notes [a] and [b] of Table 5.2.](/img/figures/cost_difference_by_scope-light.svg)
![Per-participant paired cost difference by scope, APM minus Spec-kit, in US dollars. The bar gives the session difference and the markers the planning and implementation differences within it. The reference line marks no difference. P004 and P006 have the phase-attribution caveats of notes [a] and [b] of Table 5.2.](/img/figures/cost_difference_by_scope-dark.svg)
Within an APM session, cost divided among the three agent roles in similar proportions under both models, as Table 5.3 details. The Planner and Manager cost comparable amounts, each a fraction of the Worker cost. Every role cost more under Opus than under Sonnet.
| Group | Role | Median | HL | Mean |
|---|---|---|---|---|
| Opus | Plannera | 5.50 | 5.85 | 6.53 |
| Opus | Managera | 7.35 | 7.31 | 6.97 |
| Opus | Worker | 21.76 | 21.80 | 22.91 |
| Sonnet | Planner | 2.67 | 2.67 | 2.66 |
| Sonnet | Manager | 2.68 | 2.68 | 2.62 |
| Sonnet | Worker | 9.54 | 9.25 | 9.21 |
- P004’s merged Planner/Manager conversation, explained in note [a] of Table 5.2, shifts the Opus Planner and Manager row summaries in opposite directions. Without P004 the Opus Planner median, Hodges-Lehmann estimate, and mean are 4.76, 4.76, and 4.84; the cohort values are 5.50, 5.85, and 6.53. The Opus Manager values are 7.86, 7.86, and 8.37 without P004 and 7.35, 7.31, and 6.97 for the cohort.
For both frameworks, cache-read accounted for most cost, followed by output and one-hour writes. Uncached input cost a few cents either way, and five-minute writes were negligible. APM’s output and one-hour-write costs exceeded Spec-kit’s under both models, while its cache-read cost was higher under Opus and slightly lower under Sonnet, as Table 5.4 reports.
| Group | Framework | Category | Median | HL | Mean |
|---|---|---|---|---|---|
| Opus | APM | Output | 7.99 | 7.99 | 8.32 |
| Cache read | 19.80 | 19.80 | 19.71 | ||
| Cache write (1-hour) | 7.84 | 8.07 | 8.42 | ||
| Spec-kit | Output | 4.79 | 5.00 | 5.22 | |
| Cache read | 14.96 | 14.96 | 14.98 | ||
| Cache write (1-hour) | 3.90 | 3.71 | 3.75 | ||
| Sonnet | APM | Output | 4.30 | 4.30 | 4.28 |
| Cache read | 6.72 | 6.72 | 6.70 | ||
| Cache write (1-hour) | 3.55 | 3.44 | 3.45 | ||
| Spec-kit | Output | 2.82 | 2.72 | 2.72 | |
| Cache read | 7.56 | 7.56 | 7.78 | ||
| Cache write (1-hour) | 2.54 | 2.34 | 2.27 |
Output and one-hour cache writes each carried a cohort difference of its own, while cache reading changed direction between the model groups. Table 5.5 gives the paired difference across all five categories, for the cohort and within each model group. APM produced more output than Spec-kit in all but one session and wrote more to the one-hour cache in every session. Each difference excludes zero across the cohort and is larger under Opus than under Sonnet. The cache-read difference was mixed, with its interval including zero. The five-minute cache writes carried a small positive difference.
| Group | Category | n | Sign (+/−) | Median | HL | Mean | CI |
|---|---|---|---|---|---|---|---|
| Cohort | Input | 12 | 7 / 5 | +0.00 | +0.00 | +0.01 | [−0.00, +0.01] |
| Output | 12 | 11 / 1 | +2.24 | +2.20 | +2.33 | [+1.15, +3.40] | |
| Cache read | 12 | 7 / 5 | +1.16 | +1.20 | +1.82 | [−2.33, +6.03] | |
| Cache write (5-minute) | 12 | 10 / 2 | +0.07 | +0.07 | +0.05 | [−0.00, +0.13] | |
| Cache write (1-hour) | 12 | 12 / 0 | +2.67 | +2.50 | +2.92 | [+1.28, +4.65] | |
| Opus | Input | 6 | 5 / 1 | +0.00 | +0.00 | +0.01 | [−0.01, +0.06] |
| Output | 6 | 5 / 1 | +3.28 | +3.20 | +3.10 | [−0.07, +6.12] | |
| Cache read | 6 | 5 / 1 | +3.51 | +4.91 | +4.73 | [−7.30, +17.12] | |
| Cache write (5-minute) | 6 | 6 / 0 | +0.07 | +0.08 | +0.09 | [+0.00, +0.24] | |
| Cache write (1-hour) | 6 | 6 / 0 | +3.72 | +4.51 | +4.67 | [+2.92, +8.53] | |
| Sonnet | Input | 6 | 2 / 4 | −0.00 | +0.00 | +0.00 | [−0.00, +0.01] |
| Output | 6 | 6 / 0 | +1.30 | +1.58 | +1.56 | [+0.66, +2.80] | |
| Cache read | 6 | 2 / 4 | −1.34 | −1.34 | −1.08 | [−5.74, +1.94] | |
| Cache write (5-minute) | 6 | 4 / 2 | +0.07 | +0.05 | +0.02 | [−0.29, +0.14] | |
| Cache write (1-hour) | 6 | 6 / 0 | +1.12 | +1.12 | +1.18 | [+0.20, +2.41] |
By session order, all three summaries of the session cost difference were positive in both groups, with four of the seven APM-first pairs and all five APM-second pairs positive, as Table B.1 of Appendix B.1 reports. They were larger and more consistent when participants met APM second. At seven and five participants the intervals are wide and the two order groups cannot be told apart.
Chapter 6 reads these differences further. Section 6.1 traces the planning-phase divergence to how the two frameworks carry out spec-driven planning. Section 6.2.1 reads the implementation cost, showing how working across several agents shapes where the cost falls and why the two model groups diverge.
5.2 Process
The process comparison separates the time each task took from the form and frequency of the user’s recorded interaction with each framework.
5.2.1 Temporal Shape
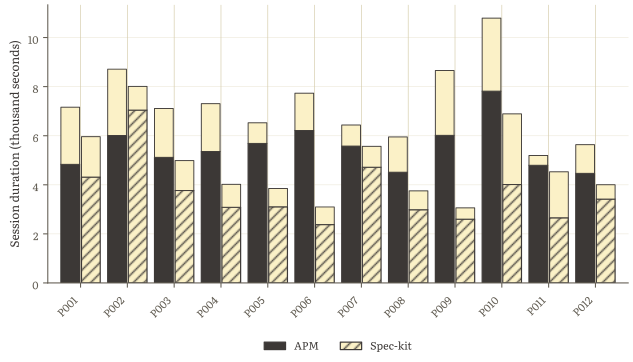
An APM session lasted a median of about 119 minutes against Spec-kit’s 71, as Table 5.6 reports. APM’s Hodges-Lehmann estimate and mean sat close to its median, while Spec-kit’s mean and Hodges-Lehmann estimate sat above its median, pulled up by a few long sessions. The two phases divided that time differently. APM’s time fell mostly in implementation, at a median of about 77 minutes against Spec-kit’s 37, while the two spent almost the same time planning, APM at about 36 minutes against Spec-kit’s 35.
| Scope | Framework | Median | HL | Mean |
|---|---|---|---|---|
| Session | APMa | 7136.1 | 7140.5 | 7267.2 |
| Spec-kit | 4274.6 | 4684.6 | 4810.1 | |
| Planning | APMb | 2153.4 | 2179.3 | 2298.9 |
| Spec-kit | 2076.5 | 2250.2 | 2356.8 | |
| Implementation | APM | 4641.5 | 4790.6 | 4865.1 |
| Spec-kitc | 2196.2 | 2228.5 | 2439.1 |
- P010’s APM session went about ten minutes past the three-hour cap and is measured to it, so that tail lies outside every summary in this row. The excluded records carry verification runs, version-control work, and framework bookkeeping, and no part of the submitted solution was written in them.
- P004’s merged APM Planner/Manager conversation, explained in note [a] of Table 5.2, raises the APM planning-duration summary. Without P004 the APM planning median, Hodges-Lehmann estimate, and mean are 1850.6, 2129.2, and 2181.7 seconds, rather than 2153.4, 2179.3, and 2298.9.
- P006’s Spec-kit agent carried out the implementation without reaching
/speckit-implement, which marks the workflow’s implementation phase for this study, so all its measurements were allocated to planning. The implementation phase therefore has no duration for that session. This lowers the Spec-kit implementation-duration summary. Without P006 the Spec-kit implementation median, Hodges-Lehmann estimate, and mean are 2210.7, 2283.4, and 2660.8 seconds. The cohort values are 2196.2, 2228.5, and 2439.1 seconds.
APM was the longer session for every participant, at a median difference of about 36 minutes, close to its Hodges-Lehmann estimate, with a confidence interval excluding zero. The session duration divides into turn time, when at least one agent was working, and inter-turn time. Both were higher under APM in eleven of the twelve pairs.
The implementation phase was longer under APM in every pair, with most of the extra duration spent in turn time, and it set the direction of the whole-session difference. The planning duration difference was mixed across participants, and its interval spans zero. Its turn time and inter-turn time divided the same way, both mixed in sign, with intervals that include zero.
Table 5.7 gives the cohort’s paired time differences at session and phase scope.
| Scope | Measure | n | Sign (+/−) | Median | HL | Mean | CI |
|---|---|---|---|---|---|---|---|
| Session | Duration | 12 | 12 / 0 | +2160.7 | +2343.6 | +2457.0 | [+1394.2, +3594.2] |
| Turn time | 12 | 11 / 1 | +1834.7 | +1868.5 | +1860.4 | [+935.0, +2845.0] | |
| Inter-turn idle | 12 | 11 / 1 | +674.4 | +650.1 | +596.7 | [+93.5, +1201.8] | |
| Planning | Duration | 12 | 5 / 7 | −258.7 | −155.0 | −57.9 | [−635.7, +467.9] |
| Turn time | 12 | 5 / 7 | −163.6 | −165.1 | −141.9 | [−668.4, +347.0] | |
| Inter-turn idle | 12 | 7 / 5 | +98.6 | +118.9 | +84.0 | [−116.0, +387.0] | |
| Implementation | Duration | 12 | 12 / 0 | +1820.6 | +2153.2 | +2426.0 | [+1097.1, +3765.3] |
| Turn time | 12 | 11 / 1 | +1498.6 | +1712.1 | +1970.2 | [+929.7, +3127.1] | |
| Inter-turn idle | 12 | 9 / 3 | +247.9 | +337.5 | +455.9 | [−39.8, +949.2] |
The same session and phase patterns held within both model groups; Table B.2 of Appendix B.2 gives the model-specific estimates.
APM was the longer session in all seven pairs where participants met it first and all five where they met it second, as the duration rows of Table B.3 in Appendix B.2 report. The three summaries are comparable across the two groups; at seven and five participants in each order the intervals are wide and the two orders cannot be told apart. The duration pattern leaves session order an unlikely account of APM’s longer sessions.
Within the turn time APM could have two or more of its agents working at once, but participants used concurrent work sparingly. In five sessions it made up less than 2% of turn time; across the cohort it remained below a sixth of turn time in all but one session, where it accounted for about a quarter. Table B.4 in Appendix B.2 gives the per-session split.
Figure 5.3 shows each participant’s two sessions as paired bars, with the filled lower part of each the turn time and the open upper part the inter-turn time. APM’s bars stand taller across the cohort, its filled turn-time segment larger than its Spec-kit pair’s for nearly every participant.
5.2.2 Interaction Shape
An APM session had a median of about 22 turn prompts against Spec-kit’s 13, as Table 5.8 reports, with the Hodges-Lehmann estimate and mean close to each median. That total was not shared evenly between the two phases. In planning, the median counts were about 10 under both frameworks, while in implementation APM had about 11 against Spec-kit’s 3.
| Scope | Framework | Median | HL | Mean |
|---|---|---|---|---|
| Session | APM | 21.5 | 22.0 | 22.2 |
| Spec-kit | 13.0 | 12.8 | 13.2 | |
| Planning | APMa | 9.5 | 9.5 | 9.7 |
| Spec-kit | 10.0 | 9.5 | 9.8 | |
| Implementation | APM | 10.5 | 11.0 | 12.2 |
| Spec-kitb,c | 3.0 | 3.5 | 3.3 |
- P004’s merged Planner/Manager conversation, explained in note [a] of Table 5.2, raises the APM planning turn-prompt count. Without P004 the APM planning turn-prompt count median, Hodges-Lehmann estimate, and mean are 9.0, 9.0, and 8.7 turn prompts. The cohort values are 9.5, 9.5, and 9.7.
- P006’s Spec-kit session opens no implementation turn prompt, for the reason given in Table 5.6 note [c]. This lowers the Spec-kit implementation turn-prompt count summary. Without P006 the Spec-kit implementation median, Hodges-Lehmann estimate, and mean are 4.0, 3.5, and 3.6 turn prompts. The cohort values are 3.0, 3.5, and 3.3.
- P007 and P009 started implementation within a planning turn of their Spec-kit sessions, so that turn remains planning and each had one subsequent implementation turn.
Paired within each participant, the added turns under APM fell almost entirely in implementation, as Table 5.9 reports. The session difference was a median of eight more turns, positive in eleven of the twelve pairs, with its interval excluding zero. Planning was level, with five pairs each way and an interval spanning zero. Implementation added a median of eight turns for APM, with a positive difference in eleven of the twelve pairs, setting the direction of the whole-session difference.
| Scope | n | Sign (+/−/=) | Median | HL | Mean | CI |
|---|---|---|---|---|---|---|
| Session | 12 | 11 / 0 / 1 | +8.0 | +8.5 | +8.9 | [+4.5, +14.0] |
| Planning | 12 | 5 / 5 / 2 | +0.0 | −0.2 | −0.2 | [−3.5, +2.0] |
| Implementation | 12 | 11 / 0 / 1 | +8.0 | +8.2 | +8.8 | [+5.0, +13.0] |
The same pattern appeared under both models, with the per-model split across the scopes given in Table B.5 of Appendix B.2.
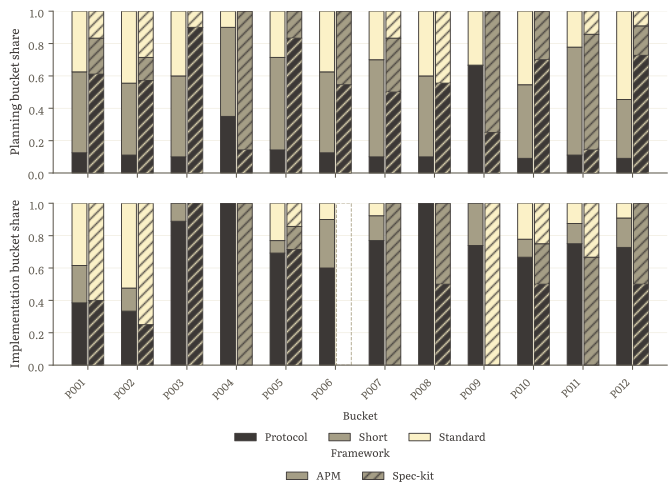
In planning, APM’s turn prompts were mostly short or standard text, at mean character counts of 19 and 146 respectively. Spec-kit’s planning instead centred on the framework’s commands, with few standard prompts from the user. That division held steady across APM’s participants, while Spec-kit’s varied widely from one session to the next.
In implementation the pattern reversed for APM, and the protocol commands that drive its workflow made up most of its turn prompts. Spec-kit’s implementation carried few turn prompts of any kind, and one session opened none. Both its division and its character counts there rest on those few prompts, too sparse to read as typical.
Table 5.10 gives each bucket’s share and mean character count, and Figure 5.4 plots each session’s shares.
| Phase | Framework | Bucket | Bucket share Median | Bucket share HL | Bucket share Mean | Magnitude (chars) Median | Magnitude (chars) HL | Magnitude (chars) Mean |
|---|---|---|---|---|---|---|---|---|
| Planning | APM | Protocol | 0.11 | 0.12 | 0.18 | 150 | 150 | 147 |
| Short | 0.50 | 0.50 | 0.47 | 20 | 20 | 19 | ||
| Standard | 0.38 | 0.37 | 0.35 | 156 | 139 | 146 | ||
| Spec-kit | Protocol | 0.56 | 0.56 | 0.54 | 106 | 109 | 114 | |
| Short | 0.26 | 0.32 | 0.34 | 20 | 20 | 20 | ||
| Standard | 0.10 | 0.08 | 0.12 | 81 | 82 | 85 | ||
| Implementation | APM | Protocol | 0.73 | 0.72 | 0.71 | 124 | 125 | 125 |
| Short | 0.13 | 0.14 | 0.14 | 18 | 20 | 20 | ||
| Standardb | 0.10 | 0.11 | 0.15 | 79 | 102 | 184 | ||
| Spec-kit | Protocol | 0.33 | 0.25 | 0.32 | 100 | 101 | 125 | |
| Short | 0.20 | 0.32 | 0.34 | 32 | 33 | 33 | ||
| Standard | 0.07 | 0.17 | 0.26 | 74 | 76 | 86 |
- Each bucket is summarised independently across the sessions, so neither the three medians nor the three Hodges-Lehmann estimates need sum to one. The three mean shares sum to one unless a session has no turn prompt in the phase and contributes three zeros.
- P002 has the largest APM implementation standard-prompt character count in the cohort by a substantial margin, from a single prompt in which the participant manually pasted handoff content. This raises all three row summaries. Without P002 the median, Hodges-Lehmann estimate, and mean are 69, 83.5, and 96 characters. The cohort values are 79, 102, and 184.
The prompt composition held under both models. The visible difference was in Spec-kit’s planning, where the protocol share was lower under Opus than under Sonnet. The character-count summaries were otherwise aligned across models, apart from APM’s Sonnet implementation standard bucket, whose mean was higher. Tables B.6 and B.7 of Appendix B.2 give the shares and character counts by model.
Within APM the turn prompts also split by agent role, as Table 5.11 reports. The Planner’s turns were those of the planning phase, while the Manager and the Workers divided the implementation phase between them, at medians of 6.5 and 5.0 turn prompts. The composition of those turns by role is given in Table B.8 of Appendix B.2. The Workers were addressed almost entirely through protocol commands, while the Manager’s prompts, mostly protocol as well, also included some short and standard text.
| Role | Median | HL | Mean |
|---|---|---|---|
| Planner | 9.5 | 9.5 | 9.7 |
| Manager | 6.5 | 6.5 | 6.2 |
| Worker | 5.0 | 5.0 | 6.0 |
Steering was sparse under both frameworks and confined to a minority of sessions. Seven of the twelve participants steered at all under APM and four under Spec-kit, most of them once or twice. No session carried more than four steers. Across the cohort that came to thirteen steers under APM, of which three were delivered to the working agent, and six under Spec-kit, of which none were delivered. Table B.9 of Appendix B.2 gives each session’s counts.
Session order did not reverse the result. The higher turn-prompt count under APM held whether participants met it first or second, as the turn-prompt rows of Table B.3 in Appendix B.2 report.
Chapter 6 interprets the added time and recorded interaction in light of the frameworks’ workflows. Section 6.1 examines planning behaviour, and Section 6.2.2 examines the demands placed on the user during implementation.
5.3 Functional
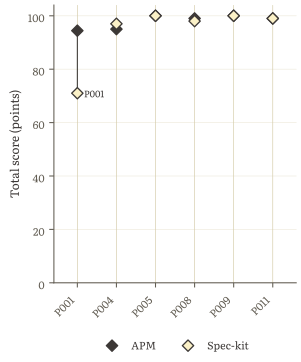
Most sessions scored near the rubric’s hundred-point ceiling. The cohort medians were close, at about 96 points under APM and 97 under Spec-kit. Lower scores pulled the mean below the median for both frameworks, more so for Spec-kit, whose three summaries lay further apart.
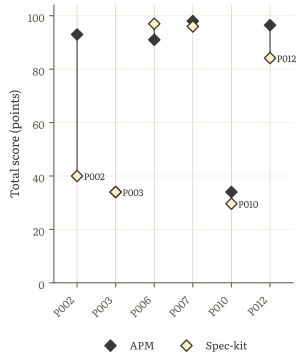
The model split changes that reading. Under Opus, all three summaries for both frameworks remained near the ceiling. Under Sonnet, APM’s median sat well above its Hodges-Lehmann estimate and mean because two sessions scored 34.0 points while the other four scored from 91.0 to 98.0. Spec-kit split into three scores from 29.6 to 40.0 and three from 84.2 to 97.0, placing its median between those clusters and much closer to its other two summaries. Table 5.12 gives the cohort and model-group summaries, and Table B.10 of Appendix B.3 lists the individual sessions.
| Group | Framework | Median | HL | Mean |
|---|---|---|---|---|
| Cohort | APM | 95.7 | 95.5 | 86.2 |
| Spec-kit | 96.5 | 84.3 | 78.8 | |
| Opus | APM | 99.0 | 97.5 | 97.9 |
| Spec-kit | 98.5 | 98.5 | 94.2 | |
| Sonnet | APM | 92.0 | 66.0 | 74.4 |
| Spec-kit | 62.1 | 63.3 | 63.5 |
Paired within each participant, the scores were close. APM scored higher than Spec-kit for six participants and Spec-kit for only two, with four pairs tied. The cohort median difference was about half a point, its Hodges-Lehmann estimate about 2 points, and its mean about 7 points. These summaries point to a small positive cohort difference, but the cohort interval includes zero.
The model-group split locates the cohort’s positive score pattern under Sonnet. Under Opus, both frameworks’ summary values remained near the ceiling, and three paired comparisons tied; the paired median and Hodges-Lehmann estimate were zero, while one +23.4-point APM difference kept the mean positive. Under Sonnet, APM’s values were higher on all three summaries, and four pairs favoured APM, one favoured Spec-kit, and one was tied.
Table 5.13 gives the cohort and model-group differences.
| Group | n | Sign (+/−/=) | Median | HL | Mean | CI |
|---|---|---|---|---|---|---|
| Cohort | 12 | 6 / 2 / 4 | +0.5 | +2.2 | +7.3 | [−0.8, +17.9] |
| Opus | 6 | 2 / 1 / 3 | +0.0 | +0.0 | +3.7 | [−2.0, +23.4] |
| Sonnet | 6 | 4 / 1 / 1 | +3.2 | +4.4 | +10.9 | [−6.0, +53.0] |
Figure 5.5 plots this contrast. Apart from one wide gap, the Opus pairs cluster at the same score, whereas the Sonnet pairs have a broader range of gaps, mostly favouring APM.
Across the cohort, both task sections had a zero median difference but positive Hodges-Lehmann estimates and means. This pattern also concentrated under Sonnet, where both sections had positive medians, Hodges-Lehmann estimates, and means. Under Opus, both section medians were zero, with a zero Hodges-Lehmann estimate for the Python extension and only +0.5 points for the C replica. Table 5.14 gives the paired section differences for the cohort and each model group.
| Group | Section | n | Sign (+/−/=) | Median | HL | Mean | CI |
|---|---|---|---|---|---|---|---|
| Cohort | Python extension | 12 | 4 / 2 / 6 | +0.0 | +2.0 | +3.4 | [−0.7, +8.7] |
| C replica | 12 | 5 / 2 / 5 | +0.0 | +1.0 | +3.9 | [−2.2, +11.5] | |
| Opus | Python extension | 6 | 1 / 1 / 4 | +0.0 | +0.0 | +1.1 | [−2.0, +8.7] |
| C replica | 6 | 2 / 0 / 4 | +0.0 | +0.5 | +2.6 | [+0.0, +14.7] | |
| Sonnet | Python extension | 6 | 3 / 1 / 2 | +2.0 | +6.3 | +5.7 | [−1.5, +18.0] |
| C replica | 6 | 3 / 2 / 1 | +1.0 | +1.9 | +5.2 | [−9.6, +35.0] |
Partial credit was identical in eight pairs and differed by no more than about six points in the other four. Table B.10 of Appendix B.3 gives the partial part of every session.
The median, Hodges-Lehmann estimate, and mean were non-negative in both order groups, as Table B.11 of Appendix B.3 reports. At seven and five participants the intervals are wide and the groups cannot be told apart. The small positive difference reads as following the framework rather than the session order.
Chapter 6 takes up these score outcomes. Section 6.1 sets the size and kind of the sessions that fell short against how each framework planned. Section 6.3.1 reads the low scores under a diagnostic re-grade, Section 6.3.2 weighs the score difference against what each framework cost, and Section 6.6 reads the same scores for a practice effect.
5.4 Perception
Some of the eight rating items divided the cohort sharply and others not at all. Table 5.15 reports, for each item, how many of the twelve participants rated it higher, lower, or the same under APM, alongside the direction that is the better outcome for that item.
| Rating | Better when | Sign (+/−/=) |
|---|---|---|
| Familiarity | context | 3 / 2 / 7 |
| Confidence | higher | 9 / 0 / 3 |
| Effectiveness | higher | 11 / 0 / 1 |
| Mental demand | lower | 6 / 2 / 4 |
| Frustration | lower | 2 / 8 / 2 |
| Effort | lower | 7 / 4 / 1 |
| Verification effort | lower | 4 / 3 / 5 |
| Steering effort | lower | 3 / 4 / 5 |
Prior familiarity was low under both frameworks, with the ratings massed at the bottom of the scale for each.
Participants rated APM the more confidence-inspiring framework in nine of the twelve pairs and the more effective in eleven, with no participant rating Spec-kit higher on either item. Under APM the effectiveness ratings clustered at the top of the scale, with every session at four or five and eight of the twelve at the maximum. The Spec-kit ratings formed two clusters, at two and four, with only two at three. The confidence ratings separated almost as far, with ten of APM’s twelve at four or five against nine of Spec-kit’s at two or three. Table 5.16 gives the per-framework distribution behind these readings for every rating.
| Rating | Framework | 1 | 2 | 3 | 4 | 5 |
|---|---|---|---|---|---|---|
| Familiarity | APM | 7 | 1 | 2 | 2 | 0 |
| Spec-kit | 8 | 2 | 2 | 0 | 0 | |
| Confidence | APM | 0 | 0 | 2 | 7 | 3 |
| Spec-kit | 1 | 5 | 4 | 1 | 1 | |
| Effectiveness | APM | 0 | 0 | 0 | 4 | 8 |
| Spec-kit | 0 | 5 | 2 | 5 | 0 | |
| Mental demand | APM | 2 | 4 | 4 | 2 | 0 |
| Spec-kit | 2 | 4 | 5 | 1 | 0 | |
| Frustration | APM | 7 | 3 | 1 | 1 | 0 |
| Spec-kit | 1 | 3 | 4 | 3 | 1 | |
| Effort | APM | 1 | 4 | 6 | 1 | 0 |
| Spec-kit | 6 | 2 | 2 | 1 | 1 | |
| Verification effort | APM | 2 | 5 | 4 | 0 | 1 |
| Spec-kit | 2 | 6 | 2 | 1 | 1 | |
| Steering effort | APM | 1 | 5 | 4 | 2 | 0 |
| Spec-kit | 1 | 6 | 3 | 2 | 0 |
Mental demand leaned towards Spec-kit, with six pairs favouring it, two favouring APM, and four tied. APM was the less frustrating framework in eight of the twelve pairs, with its frustration ratings low and Spec-kit’s spread upward across the scale. Set against this, participants reported investing more effort under APM in seven of the twelve pairs and more under Spec-kit in four. Spec-kit’s own effort ratings massed low, with half its sessions at the minimum. The effort of checking what the agent produced and the effort of instructing and steering it showed no consistent direction.
The comparison question asked after the second session, grouped by the framework that session used, gave a less decided verdict, as Table B.12 of Appendix B.4 reports. Among the five whose second framework was APM the verdicts split evenly between easier and harder, with one rating it the same.2 Among the six whose second framework was Spec-kit four leaned harder and the other two were divided.
Nineteen of the twenty-four sessions finished comfortably within the three-hour cap and five finished near it, nine against three under APM and ten against two under Spec-kit. No participant reported hitting the cap without completing or stopping early, leaving the other two states in Table B.13 of Appendix B.4 empty.
Section 6.4 reads these ratings against the measured behaviour behind them, and Section 6.5 weighs them alongside the study’s other findings.